Friday, October 11, 2013

Dr. Michael Mann's Court Saga - Oct 2013 Update

It appears the witch-hunt for Dr. Michael Mann continues unabated, and though I'm trying to keep this blog away from the mud-fight that the public climate science dialogue has devolved into and stick to straight science and personal essays about more positive aspects of Earth observations, such as my article about the Grand Canyon's formation, I still want to link to a series of posts I put up yesterday at my "mud wrestling" blogspot WhatsUpWithThatWatts.  

The series was in reaction to the renewed attacked on Dr. Mann within the right-wing/libertarian blogosphere community.  For those who would like to learn about what's going on and about the scientific background, check it out.  It includes many links and reposting from more expert sources.


Thursday, October 10, 2013
Michael Mann's continuing saga, Virginia FOIA case continues
~ ~ ~

Thursday, October 10, 2013
Investigating Dr. Michael Mann... a supplement
~ ~ ~

Thursday, October 10, 2013
The Other Dr.Mann Court Case

Friday, September 27, 2013

IPCC Report Highlights - The Scientific Basis for Global Warming


The first of the long awaited IPCC's Fifth Assessment Reports (AR5) has been released today.  It's from the IPCC Working Group 1 (WG1) and focuses on the scientific basis of climate change and contains 14 chapters plus a lot of supplementary material.

In this post I will reprint highlights from the IPCC Working Group 1 report 
"Climate Change 2013: The Physical Science Basis"

Sunday, September 15, 2013

Understanding "Ancient Landscapes" of the Colorado Plateau


Though my web presence is mainly about trying to help circulate facts about what we the people are doing to our life sustaining Global Heat Distribution Engine (aka Climate).  I do have many other interests, including a life long passion for learning about our planet's incredible four and a half billion year journey of creation.  

Recently I spent a few days at the Grand Canyon attending a geology course given by Wayne Ranney and it was such a wonderful experience I wrote a story for the September issue of the Four Corners Free Press out of Cortez, Colorado.  Since they allow me to retain the rights, I want share it here.  I also want to thank Gail Binkly, editor at the FCFP for helping me 'clean up' my writing. 

~ ~ ~ ~ ~ ~ ~ ~ ~ ~ ~ ~ ~ ~ ~ ~ ~ 

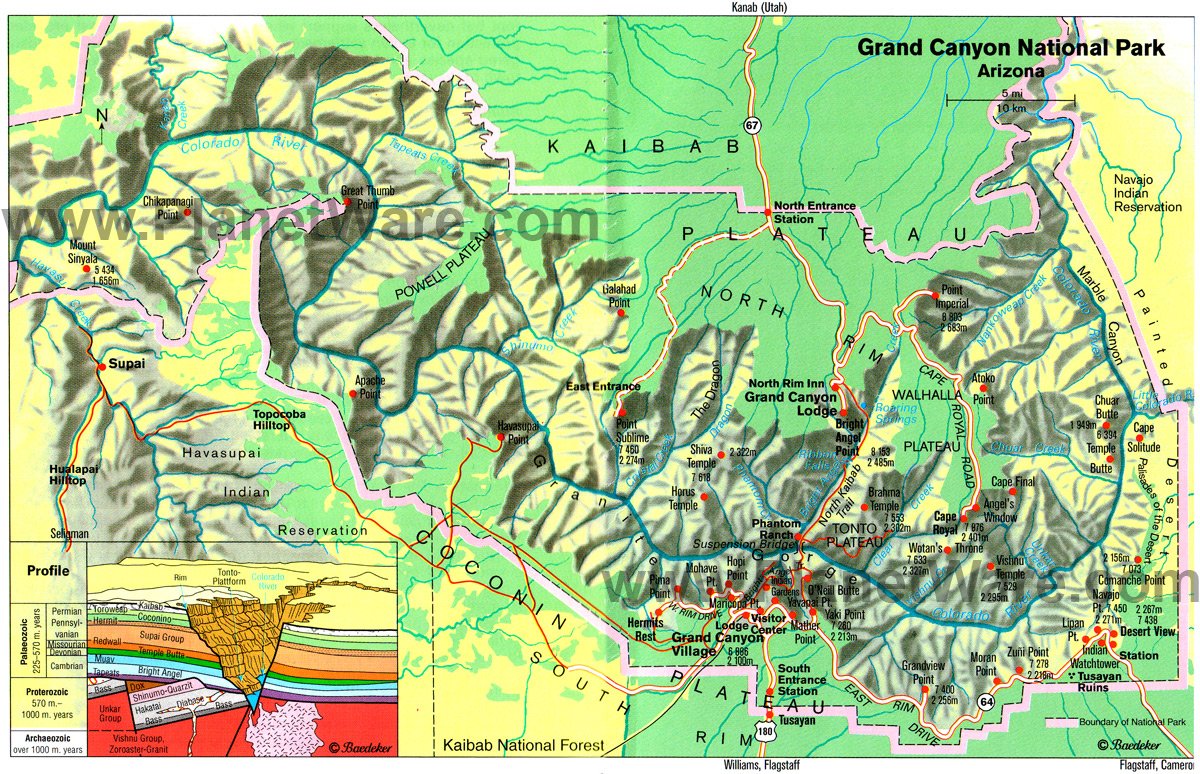
A recipe for creating the Grand Canyon


http://www.planetware.com

At 58 I can honestly say that geology has fascinated me for nearly half a century. Those first National Geographic maps and Popular Science stories about Earth's tectonic plates and the Ring of Fire grabbed my young imagination. Within a few years I learned that the Plate Tectonic Revolution could explain the full spectrum of geological phenomena we witness on Earth, from earthquakes to mountain building to precious metals and oil formation and much more.

Saturday, August 31, 2013

Greenfyre's "Mr. Sinclair's Video collection" - manmade global warming education made easy


I came across this a few weeks back and think it's a first class concise index of Peter Sinclair's "Climate Denial Crock of the Week" series.  Best part is that he follows his list with the actual videos.  Heck, it's sort of a collector's edition.

Since the driving interest behind this here blogspot is to share serious information about Our Grand Geophysical Experiment. I feel honored to echo Greenfyre's list of videos over here. 


Though first I thought I'd share a little about the man behind this particular blog:

My heart is moved by all I cannot save:

So much has been destroyed

I have to cast my lot with those
Who age after age, perversely,
With no extraordinary power,
Reconstitute the world.

Quote by Adrienne Rich
Here are a some exerts from what he has to say for himself

Tuesday, August 20, 2013

American Meteorological Society report: State Of The Climate 2012


Here's yet another authoritative report driving home the reality that serious global warming is underway and that further avoidance of this issue will lead to destructive consequences for our society's continued health and well-being.

Copied from:

 http://www.noaanews.noaa.gov/stories2013/20130806_stateoftheclimate.html

2012 was one of the 10 warmest years on record globally

The end of weak La Niña, unprecedented Arctic warmth influenced 2012 climate conditions

August 6, 2013
State of the Climate in 2012 - report cover.
The 2012 State of the Climate report is available online.
(Credit: NOAA)
Worldwide, 2012 was among the 10 warmest years on record according to the 2012 State of the Climate report released online today by the American Meteorological Society (AMS). The peer-reviewed report, with scientists from NOAA’s National Climatic Data Center in Asheville, N.C., serving as lead editors, was compiled by 384 scientists from 52 countries (highlightsfull report). It provides a detailed update on global climate indicators, notable weather events, and other data collected by environmental monitoring stations and instruments on land, sea, ice, and sky. 
“Many of the events that made 2012 such an interesting year are part of the long-term trends we see in a changing and varying climate — carbon levels are climbing, sea levels are rising, Arctic sea ice is melting, and our planet as a whole is becoming a warmer place," said Acting NOAA Administrator Kathryn D. Sullivan, Ph.D. “This annual report is well-researched, well-respected, and well-used; it is a superb example of the timely, actionable climate information that people need from NOAA to help prepare for extremes in our ever-changing environment."
Conditions in the Arctic were a major story of 2012, with the region experiencing unprecedented change and breaking several records. Sea ice shrank to its smallest “summer minimum” extent since satellite records began 34 years ago. In addition, more than 97 percent of the Greenland ice sheet showed some form of melt during the summer, four times greater than the 1981–2010 average melt extent.
Temperature in 2012 compared to the 1981-2010 average.
Temperature in 2012 compared to the 1981-2010 average. Credit: NOAA Climate.gov, based on NCDC data. See more.
The report used dozens of climate indicators to track and identify changes and overall trends to the global climate system. These indicators include greenhouse gas concentrations, temperature of the lower and upper atmosphere, cloud cover, sea surface temperature, sea-level rise, ocean salinity, sea ice extent and snow cover. Each indicator includes thousands of measurements from multiple independent datasets.
Highlights:
  • Warm temperature trends continue near Earth’s surface: Four major independent datasets show 2012 was among the 10 warmest years on record, ranking either 8th or 9th, depending upon the dataset used. The United States and Argentina had their warmest year on record.
  • La Niña dissipates into neutral conditions:  A weak La Niña dissipated during spring 2012 and, for the first time in several years, neither El Niño nor La Niña, which can dominate regional weather and climate conditions around the globe, prevailed for the majority of the year. 
  • The Arctic continues to warm; sea ice extent reaches record low: The Arctic continued to warm at about twice the rate compared with lower latitudes. Minimum Arctic sea ice extent in September and Northern Hemisphere snow cover extent in June each reached new record lows. Arctic sea ice minimum extent (1.32 million square miles, September 16) was the lowest of the satellite era. This is 18 percent lower than the previous record low extent of 1.61 million square miles that occurred in 2007 and 54 percent lower than the record high minimum ice extent of 2.90 million square miles that occurred in 1980. The temperature of permafrost, or permanently frozen land, reached record-high values in northernmost Alaska. A new melt extent record occurred July 11–12 on the Greenland ice sheet when 97 percent of the ice sheet showed some form of melt, four times greater than the average melt this time of year.
  • Antarctica sea ice extent reaches record high: The Antarctic maximum sea ice extent reached a record high of 7.51 million square miles on September 26. This is 0.5 percent higher than the previous record high extent of 7.47 million square miles that occurred in 2006 and seven percent higher than the record low maximum sea ice extent of 6.96 million square miles that occurred in 1986.
  • Sea surface temperatures increase: Four independent datasets indicate that the globally averaged sea surface temperature for 2012 was among the 11 warmest on record.  After a 30-year period from 1970 to 1999 of rising global sea surface temperatures, the period 2000–2012 exhibited little trend. Part of this difference is linked to the prevalence of La Niña-like conditions during the 21st century, which typically lead to lower global sea surface temperatures.
  • Ocean heat content remains near record levels: Heat content in the upper 2,300 feet, or a little less than one-half mile, of the ocean remained near record high levels in 2012. Overall increases from 2011 to 2012 occurred between depths of 2,300 to 6,600 feet and even in the deep ocean.
  • Sea level reaches record high: Following sharp decreases in global sea level in the first half of 2011 that were linked to the effects of La Niña, sea levels rebounded to reach record highs in 2012. Globally, sea level has been increasing at an average rate of 3.2 ± 0.4 mm per year over the past two decades.
  • Sea ice concentration reached a new record low in mid-September 2012.
    Sea ice concentration reached a new record low in mid-September 2012. Credit: NOAA Climate.gov, based on NSIDC data. See more
    Ocean salinity trends continue:Continuing a trend that began in 2004, oceans were saltier than average in areas of high evaporation, including the central tropical North Pacific, and fresher than average in areas of high precipitation, including the north central Indian Ocean, suggesting that precipitation is increasing in already rainy areas and evaporation is intensifying in drier locations.
  • Tropical cyclones near average: Global tropical cyclone activity during 2012 was near average, with a total of 84 storms, compared with the 1981–2010 average of 89. Similar to 2010 and 2011, the North Atlantic was the only hurricane basin that experienced above-normal activity.
  • Greenhouse gases climb: Major greenhouse gas concentrations, including carbon dioxide, methane, and nitrous oxide, continued to rise during 2012. Following a slight decline in manmade emissions associated with the global economic downturn, global CO2 emissions from fossil fuel combustion and cement production reached a record high in 2011 of 9.5 ± 0.5 petagrams (1,000,000,000,000,000 grams) of carbon , and a new record of 9.7 ± 0.5 petagrams of carbon  is estimated for 2012. Atmospheric CO2 concentrations increased by 2.1 ppm in 2012, reaching a global average of 392.6 ppm for the year. In spring 2012, for the first time, the atmospheric CO2concentration exceeded 400 ppm at several Arctic observational sites.
  • Cool temperature trends continue in Earth’s lower stratosphere: The average lower stratospheric temperature, about six to ten miles above the Earth’s surface, for 2012 was record to near-record cold, depending on the dataset. Increasing greenhouse gases and decline of stratospheric ozone tend to cool the stratosphere while warming the planet near-surface layers.
The 2012 State of the Climate report is peer-reviewed and published annually as a special supplement to theBulletin of the American Meteorological Society. This year marks the 23rd edition of the report, which is part of the suite of climate services NOAA provides to government, the business sector, academia, and the public to support informed decision-making. The full report can be viewed online.
NOAA’s mission is to understand and predict changes in the Earth's environment, from the depths of the ocean to the surface of the sun, and to conserve and manage our coastal and marine resources. Join us on FacebookTwitter and our other social media channels.

The Great March for Climate Action...


Sharing some information about a long March planned from L.A., California to Washington, DC, 2,980 miles, with the goal of raising public and political awareness and to help pressure our lawmakers to finally constructively address the climate change crisis in a proactive manner.  

Here's a short video and a message from the originator of this challenge, Iowa's Ed Fallon.  


MARCH!To march,
 click Marcher Application, Word version or Marcher Application, PDF version.
We are taking applications for full-time and part-time marchers.

~ ~ ~ ~ ~ ~ ~ ~ ~ ~ ~ ~ ~ ~ ~  
The goal of the Great March for Climate Action is to change the heart and mind of our fellow Americans and our elected leaders. On March 1, 2014, 1,000 climate patriots will set-out from Los Angeles, CA, walking 2,980 miles across America to Washington, DC, inspiring and motivating the general public and elected officials to act now to address the climate crisis. This will be the largest coast-to-coast march in American history.
~ ~ ~ ~ ~ ~ ~ ~ ~ ~ ~ ~ ~ ~ ~  

The Great March for Climate Action was launched on March 1, 2013 by former Iowa lawmaker Ed Fallon.  Here's a portion of his announcement speech:
“... I’ve been involved with a lot of campaigns over the years, both political campaigns and issue campaigns. It’s time for another. This campaign will be the most difficult. It will be the most expensive. And it will be one of the two longest campaigns I’ve ever run. 
“But it will not be a campaign for public office. 
“This is a campaign to mobilize 1,000 people to march coast-to-coast, demanding action on climate change – action from both the American people and from our public officials. The Great March for Climate Action will set-out from the west coast one year from today and arrive in Washington, DC the weekend before the mid-term election. It will be the largest coast-to-coast march in our nation’s history. 
“For a long time, I’ve recognized that climate change is not simply an issue. Climate change is a crisis, possibly the deadliest crisis humanity has ever faced. And it’s not a crisis that might happen somewhere in the future. It is a crisis that is happening NOW! 
“For the past six years, I’ve asked myself what I should do? What’s my duty, my responsibility in this crisis? What do I have to offer that can help avert the calamity barreling our way like a coal-fired freight train? 
“I discuss climate change on my talk show regularly, and I continue to live more and more sustainably in my personal life. But honestly, I don’t feel I’ve come close to doing enough, to doing my part. There are certainly people and organizations who have, like Bill McKibben, James Hansen, the Sierra Club, Physicians for Social Responsibility, and Iowa’s own State Senator Rob Hogg. 
“But it is past time for me to step up to the plate in a focused and significant way. Again, this is a CRISIS! 
“Two weeks ago, the idea of this March came to me, and as I thought about it and talked about it with a few close friends, I realized it was the campaign I needed to commit myself to. 
“Why a march? Throughout history, marches have been powerful tools to mobilize people – physically, spiritually, and politically. In 1913, the Women’s Suffrage March in Washington, DC numbered 5,000 strong. In 1930, Mahatma Gandhi led the 240-mile Salt March to defy Britain’s imperial power. In 1965, Martin Luther King, Jr led the five-day march for voting rights from Selma to Montgomery. And in 1986, the Great Peace March for Global Nuclear Disarmament left Los Angeles on March 1st, traveling 3,700 miles to finish in Washington, DC on November 15th. ..."

For the entire speech link to: http://climatemarch.org 
also see: http://fallonforum.com

Wednesday, August 14, 2013

INDEX for my Climate Science Video Collection


I've been collecting and posting some first class climate science education videos and lectures.  The posts have gotten so numerous that I believe it's time for an index.

Enjoy and happy learning!

Monday, April 8, 2013 
A video and lecture tour of our Global Heat Distribution Engine...
~ ~ ~ ~ ~ ~ ~  
Monday, April 15, 2013 
Videos of scientist's lectures: Global Warming Education
~ ~ ~ ~ ~ ~ ~  
Monday, April 15, 2013 
More videos: What We Knew In 1988, plus a few updates
~ ~ ~ ~ ~ ~ ~  
Wednesday, April 24, 2013 
Andy Lee Robinson: Visualizing Arctic Ice Loss
~ ~ ~ ~ ~ ~ ~  
Saturday, May 11, 2013  
Dr. Trenberth Lecture: The Role of the Oceans in Climate
~ ~ ~ ~ ~ ~ ~   
Tuesday, May 14, 2013 
Prof. Mitrovica's "Enigma of Global Sea Level Rise" - lecture with notes
~ ~ ~ ~ ~ ~ ~  
Saturday, July 27, 2013 
James Balog, Chasing Ice and finding Extreme Ice Loss
http://citizenschallenge.blogspot.com/2013/07/james-balog-chasing-ice-and-finding.html 
~ ~ ~ ~ ~ ~ ~   
Monday, August 12, 2013 
The Changing Arctic - A Video Collection of What We Know
~ ~ ~ ~ ~ ~ ~  
Tuesday, August 13, 2013

Videos and lectures explaining Climate Models
~ ~ ~ ~ ~ ~ ~ 
Saturday, January 26, 2013  
Video on Climate Change Lines of Evidence by the National Academy of Science
http://citizenschallenge.blogspot.com/2013/01/7-part-video-series-what-is-climate.html 
Video on Climate Change Lines of Evidence by the National Academy of Science
Posted on 26 January 2013 by John Cook 
The U.S. National Academy of Science have produced a series of videos providing a basic overview of climate science - the series is called Climate Change: Lines of Evidence
The 7 chapters covered are:
Chapter 1: What is Climate? 
Chapter 2: Is Earth Warming? 
Chapter 3: Greenhouse Gases 
Chapter 4: Increased Emissions 
Chapter 5: How Much Warming? 
Chapter 6: Solar Influence 
Chapter 7: Natural Cycles
You can also watch the entire series in a single YouTube video 


~ ~ ~ ~ ~ ~ ~ ~ ~ ~ ~ ~ ~ ~ ~ ~ ~ 
Also this collection from Greenfyre

The collected videos of Peter Sinclair’s excellent series

“Climate Denial Crock of the Week” :